Tuesday, June 3, 2014

Day 24: AC Circuits

RMS and AC Current and Voltage

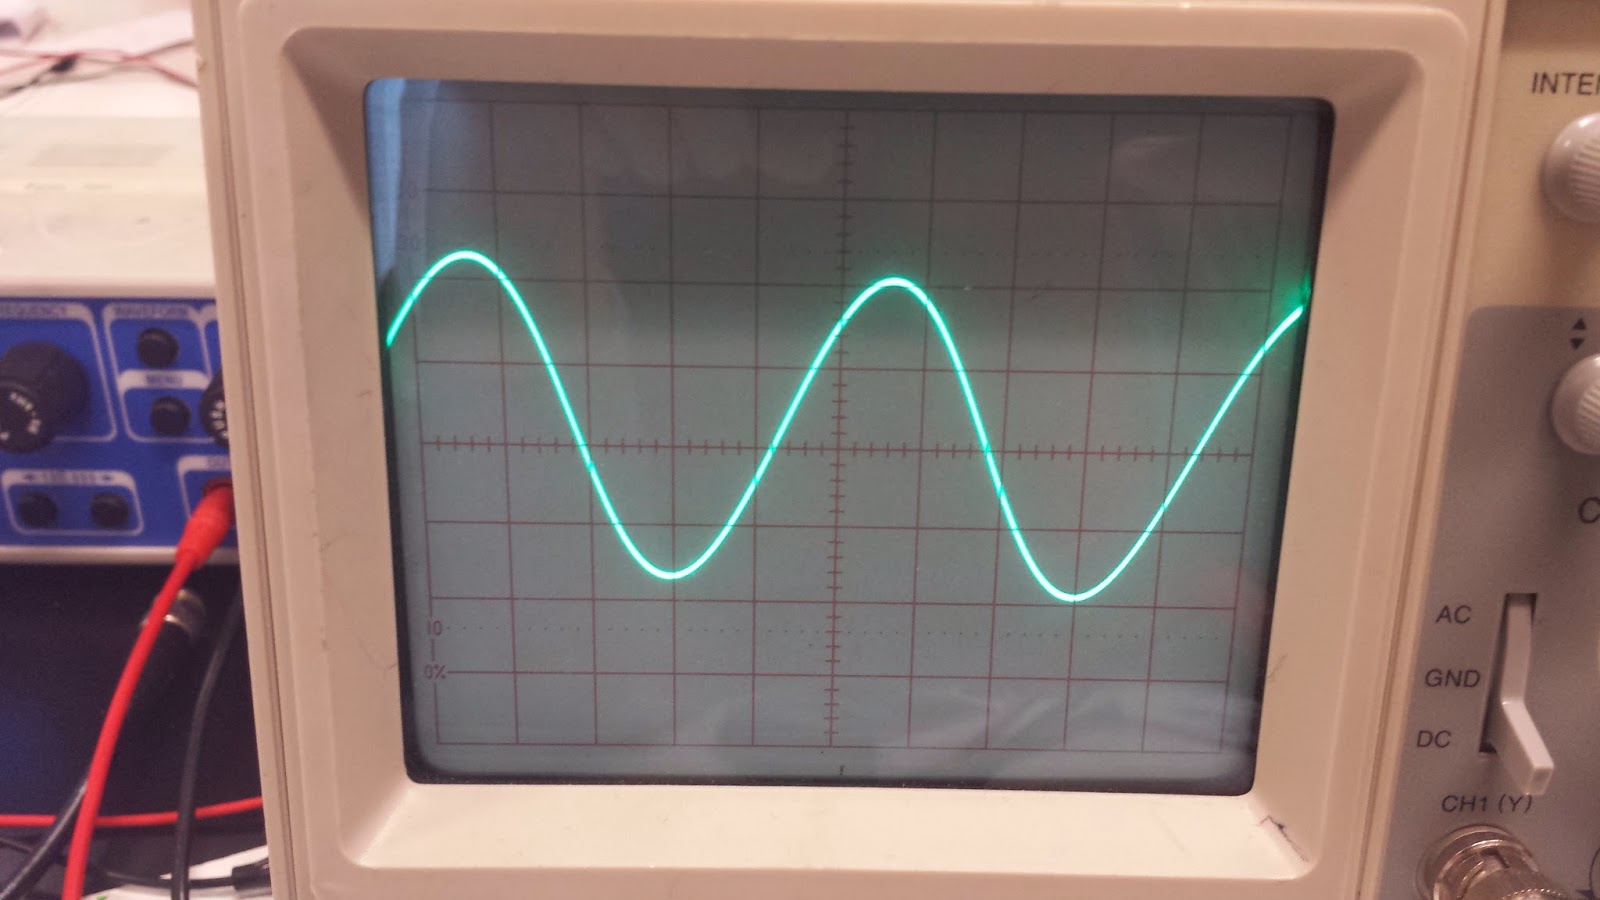
For our first experiment we connected a 220µF capacitor in series with a function generator that was feeding a 10Hz sinusoidal wave into the circuit.


The above pictured image is the result of the data collected from the AC Circuit. It is clear that the current and voltage are sinusoidal and that there is a phase shift between the two graphs. 

After testing the circuit at 10Hz we doubled the frequency to 20Hz and repeated the experiment. As seen below the graphs again were the same just with a difference in phase shift. 


Our results for Vmax, Vrms, Imax, Irms, and XC (theoretical and experimental). can be seen below for both experiments. 


The next part of this experiment was the same as the first however this time we used an inductor. We repeated all the same steps as for the capacitor and went on to calculate Vmax, Vrms, Imax, Irms, and XL (theoretical and experimental).


The picture above shows the set up for the inductor circuit, however to prevent an over current error we had to connect a 100Ω resistor in series with the circuit. Instead of changing the frequency we took two sets of data without an iron core and with an iron core (small bolt).  Our data is shown below.


Saturday, May 31, 2014

Day 23: Inductors

Measuring Inductance

In the above seen experiment we connected an inductor (internal resistance of 1.2Ω), function generator(internal resistance of 50Ω), and a 150Ω resistor in series. We also connected the circuit to the oscilloscope to see the output.


The above picture shows the outcome of the circuit. It was fed a square wave at a frequency of 2kHz and 10 Volts.


Using the above image we determine t1/2 for the exponential decay which turned out to be about 10µs. We then used the half time to determine the value of the time constant, TL. We then plugged this value into out formula for inductance and found the experimental value of inductance (pictured below).


In addition to finding the experimental inductance (2.89mH) we also calculated the theoretical inductance for our inductor based on the area of the cross section and its length. After plugging in those values for the inductance formula we discovered that the theoretical inductance should have been about 1.61mH which is about half of experimental value. In order to double check the numbers Prof. Mason measured the inductance and found it to be 1.65mH. 


ActivPhysics: Electromagnetic Induction


At the beginning of class we did an ActivPhysics assignment in which we tested our knowledge on the concept of inductance. Given different scenarios we were asked to determine what would happen to the flux and magnetic fields. 

Tuesday, May 27, 2014

Day 22: Solenoids and Magnetic Fields

Solenoid

For this experiment we took a clear plastic tube and wrapped a wire that was attached to a power supply making a coil. We started out at 1 loop and gradually increased to a max of 5 loops. We placed a magnetic field sensor inside of the tube ensuring the sensor was above/below the center of the coil. As we took measurements we found some discrepancy in the results. Therefore, the experiment was redone by Mason and the results were as follows:


After writing down the results above we calculated the ratio of the magnetic field, B, divided by NI, the number of loops times the current.  We saw that around 4 and 5 loops the ration maxed out at about 3.5*10^-5 T/A. Using this value we calculated the length of wire used to compose the solenoid. 


We determined that the length of the wire would have to be 0.0359 m long. 

Magnet in Motion

We connected a large coil to an ammeter and were given a magnet. Using these tools we were asked to induce a current. We discovered that if you move the bar magnet in or out of the coil it induces a magnet. Thus arriving at the following conclusions:


The above 3 factors all affected the magnitude of the magnetic field. 


Sunday, May 18, 2014

Day 21: Earth's Magnetic Field

Calculating the Magnetic Field of the Earth


Using the above pictured apparatus we experimentally determined the magnetic field of the Earth from our classroom.


Using what we know about the Biot-Savart Law we calculated the magnetic field for the coil using current, the number of coil turns, radius and the constant. We then used the relationship between the magnetic field of the earth and coil to determine the field. In order to determine this we used the deflection of the compass (in degrees) at a know current and solved for the magnetic field of the earth by dividing the magnetic field of the coil by tangent of theta. We graphed our results below (Magnetic Field of the Coil vs Tan(theta)).


Once we fit a linear line to this we knew that the slop of the data set would be the magnetic field of the earth which was about 1.055*10^-5 T.

Tuesday, May 13, 2014

Day 20: Motors and Magnetic Field Lines

Magnetic Motors

We attached the power supply to the motor and it began to spin.


When we reversed the direction of current it began to spin in the opposite direction. 

Our Magnetic Motor

We created our own version of a magnetic motor by using a copper wire, magnets, two paperclips, and a power supply. First we wrapped the wire in a way to get a symmetric oval. We then sanded 360 degrees of one lead of the wire and 180 degrees of the other lead. We attached the paper clips to the top of a cup and placed a magnet in the center. We then attached the power supply to the paperclips and rested the wire leads between the loops. When we turned on the power supply current moved through the wire and the magnetic field caused it to turn. 


Sunday, May 11, 2014

Day 19: Magnetic Field

Points Around A Magnet
Using a compass, seen in the upper left hand corner of the photo, we were asked to draw the direction of north as we rotated the compass around the magnet. We drew several arrows of which way north was indicated on the compass in intervals around the magnet. When the compass was closest to the North end of the magnet the compass indicated that north was towards the magnet (indicating N on the compass was actually S, because N on the compass would be attracted to S not N.). When the compass was nearer to the South end of the magnet it indicated that north was in the opposite direction.  

Magnetic Field Lines Around a Magnet

Magnetic Field and Rod
This was our in class attempt at solving for the magnetic field but we realized that our units didn't work. 


Increasing Magnetic Field

Tuesday, May 6, 2014

Day 18: Diodes and Transistors

One Transistor Amplifier
Using the given drawing we recreated this on the bread board shown below. 

The above pictured set up was used to create an amplifier that amplified a 3 kHz wave/frequency at 0.3 V with a 2N3904 transistor.  


The final result was an amplification of about 100 times the original. The two waves on the screen show the wave being emitted by the function generator and the amplification of the breadboard circuit. The original voltage was about 0.3 V and our new voltage was now roughly 20-30 V.  

Amplifier with Gain = 20 (Minimum Parts) 

Using this drawing from the National Semiconductor/TI Guide we created another amplifier using a LM386 audio amplifier. 

After viewing the diagram we came up with the following set-up that actually did produce sound on a speaker when played back. There was static, but you could clearly hear the music playing. 


Sunday, May 4, 2014

Day 17: Electronics

Measuring Changing Voltages


We attached a function generator to our oscilloscope and set the function generator to 96 Hz. The result was the above pictured sinusoidal wave. We were asked to determine its theoretical and experimental period. In order to determine the theoretical period we used t=1/f, where t=period and f=frequency. Since we knew our frequency we just plugged in the values and got t=0.010417 s. Based on our graph we found the period for one cycle of the wave. We determined that the wave's period was 5.1. However, we needed to multiply this by our time division of 2 ms. Therefore our experimental period was t=(5.1*.002)=0.0102 s.


These pictures show what occurred when we changed the sinusoidal wave to a triangle wave (left) and square wave (right). 

Power Supply (DC Source)


For this next experiment we were asked to find the amplitude and period. We determine the amplitude of the DC Power Supply to be roughly 39 mV. The period however was much more difficult to determine and we were unable to find it. 

AC Transformer


For the AC Transformer we were again asked to determine amplitude and period. This was much easier because the wave that was emitted was sinusoidal in nature. We found the amplitude to be 20 V and the period to be t=(8.51*.002)=.01702. For this transformer we also found the frequency which was f=58.8 Hz. 

Lissajous Figures (Using AC Transformer)


This time around we connected the same AC Transformer as before to CH 1 and the Function Generator to CH 2. The function generator was set to 30 Hz and the oscilloscope was set up so that in the XY mode we could see Lissajous Figures of the to channels. At 30 Hz we got the above shape that twisted and rotated over time.


When we set the Function generator to 60 Hz, the shape was clearly circular/oval. This shape too rotated about. 

Mystery Box: Solve Whats In It.

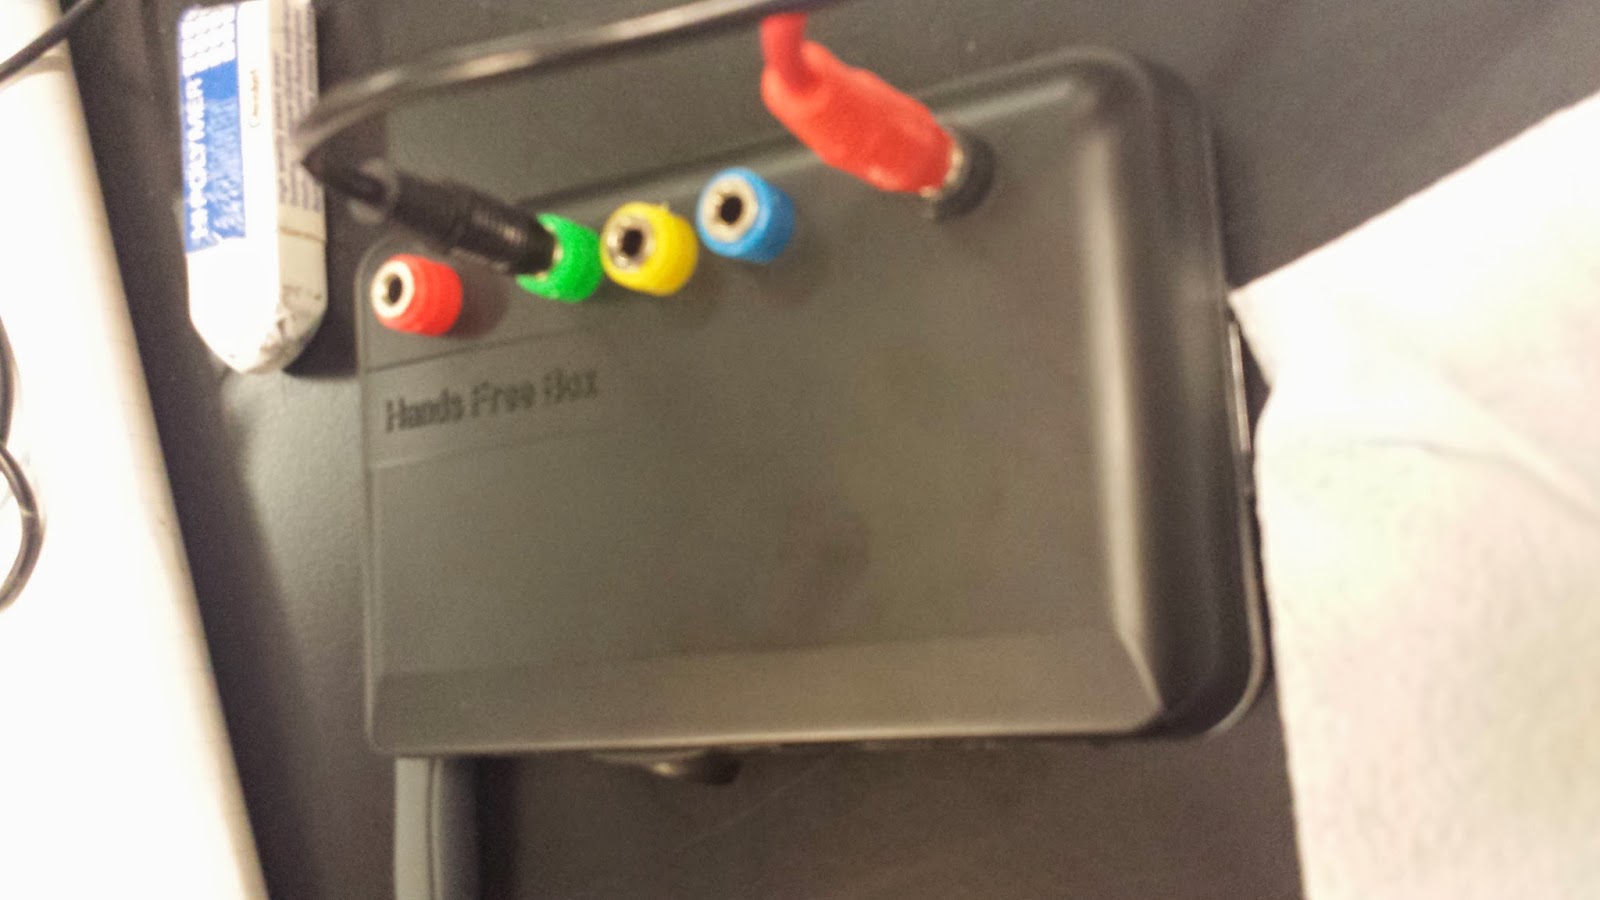
We were given a mystery box and told to determine which waves or frequencies it consisted of. The bellow pictures are a summary of our findings. 

Red and Black
Square Frequency
Amplitude=4 V
Period=0.0044 s

Red and Blue
Square Frequency
Amplitude=1.8 V
Period=0.0043 s

Red and Green
Square Frequency
Amplitude=4 V
Period=0.0042 s

Blue and Black
Square/Sinusoidal Frequency
Amplitude=0.02 V
Period=0.003 s

Green and Black
Sinusoidal/Square Frequency
Amplitude=0.008 V
Period=0.0044 s

Although there are other options, none of them produced real results. Yellow for example produced no real waves in combination with any of the possible colors. Other combinations also had the same result or resulted in a lot of noise/static. This we determined that the mystery box had some combinations of square and sinusoidal frequencies.