Tuesday, March 25, 2014

Day 9: Dipoles and Electric Flux

Flux as a Function of Surface Angles 


In this activity we used an "Electric Field" of nails and a square metal wire to determine the angle, θ, between the normal vector to the surface and the electric field. When the surface enclosed 49 nails (7x7) the angle between the the normal vector and electric field vector was 0° because the vectors were pointing in the same direction. As we began to enclose less and less nails (42, 35, 28, 21, 14...etc.) the angle between the normal vector and the electric field increased until we enclosed 0 nails and got an angle of 90°. In order to measure the angle of the nails we measured the distance of the diagonal and the height of the wire (see picture below). Using these measurements and trigonometry we were able to solve for the angle between the normal and electric field vectors in both degrees and radians.


After calculating the angles we graphed the Number of Nails (field lines) vs the Angles between the Normal and Electric Field Vectors (radians) in Logger Pro and fit a sine/cosine curve because it best represented the data set. We had trouble getting the curve to properly fit the graph so we manually fit it.


ActivPhysics: 11.7 -- Electric Flux

Question 1: Flux Into or Out of an Oval
Design your own experiments to see how electric charge affects the flux into or out of the oval. In your experiments, you can:
• change the shape of the oval;
• move the center of the oval so that it surrounds the charge or does not surround the charge; and
• change the magnitude and sign of the electric charge.
When finished, develop in words a qualitative rule to determine the electric flux flowing into or out of the oval. Give examples to support your statements. When finished, compare your thinking with that of the Advisor.


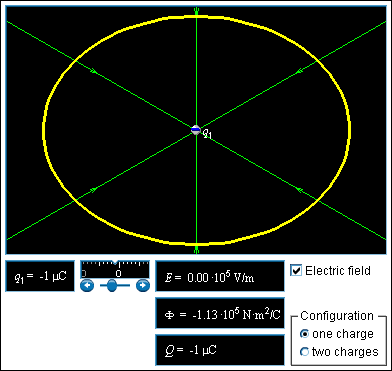
Answer: Based in the images above we concluded that when there was a net positive charge inside of the oval the flux was also positive. If we increased the charge then the flux proportionally increased as well. When the oval had a zero net charge within it, the flux was also zero. When there was a net negative charge inside the oval the flux was also negative. This leads us to believe that flux is proportional to the net charge inside the contained surface. 

Question 2: Electric Flux with Two Charges
In the simulation, click the "two charges" configuration. You can now adjust the sign, magnitude and separation of two electric charges. Repeat the experiments such as done in Question 1 to see if your rule applies for this two charge system. You can:
• change the shape of the ring;
• change the position of the center of the ring (move it all over); and
• change the magnitudes and signs of the electric charges.
When finished, compare your thinking with that of the Advisor.


 Answer: For the case of two charges we found the results to mimic those of the one charge case. If the net charge inside the oval was positive then we got a positive flux. If the net charge was negative there was a negative flux. If the oval didn't surround a charge, or the net charge inside the oval was zero then we had no flux. 

Question 3: First way to determine electric flux
Change the simulation back to "one charge." The meter indicates the electric flux Φ into or out of the oval and the net electric charge Q inside the oval.
• What happens to the flux if you double or triple the positive electric charge inside the oval?
• What happens to the flux if you double or triple the negative electric charge inside the oval?
• Find an equation with a proportionality constant that relates the electric flux into or out of the oval and the electric charge inside the oval.
After answering the questions, compare your thinking with that of the Advisor.


 Answer: When we doubled or tripled the charge we saw that the flux also double or tripled accordingly. If the charge was negative and we increased it by a factor of 3 we saw the flux proportionally triple as well. The same is true for the positive charge. This tells us that flux is directly proportional to the net charge inside of the oval.

Question 4: Second way to determine electric flux
The green electric field lines represent the electric field surrounding the source charges. Develop a rule for the electric flux passing out of or into the oval by counting the electric field lines passing out of or into the oval. After answering the questions, compare your thinking with that of the Advisor.

Answer: Based on what we've seen thus far the number of flied lines going in/out is directly proportional to the flux.


Friday, March 21, 2014

Day 8: Electric Fields

ActivPhysics 11.4:Electric Field -- Point Charge

Open the electric force simulation.
Electric field and electric force:
Consider charge Q1 = 10.0 x 10⁻⁸ C in the simulation as the source of an electric field, just as the earth's mass is the source of a gravitational field. This electric field exerts an electric force on any charge, such as Q2, that is placed in the field (just as the earth's gravitational field exerts a force on the mass of your body when placed in that field).
We can probe the field produced by source charge Q1 by using a positive test charge Q2. The field that the source charge Q1 produces at some position points in the direction of the force

that Q1 exerts on Q2, divided by Q2:

 .

Question 1: Explore the electric field
Suppose that Ball 1 at the bottom of the simulation screen is the source of the electric field. Increase the charge of Q2 to +4.0 x 10⁻⁸ C. Use it to probe the electric field produced by Q1. To see this field, grab Q2 and move it around. Notice that if Q2 gets closer to the location of Q1, the magnitude of the electric force exerted on Q2 increases--the electric field is greater. If Q2 is moved farther away from Q1, the magnitude of the electric force exerted on Q2decreases--the electric field is less. After systemmatically moving Q2 around the region surrounding Q1, summarize in words your observations about the direction of the electric field produced by Q1 at different points in space and how the field's magnitude varies. When finished, compare your observations to those of the Advisor.


Answer: As seen from the above picture the electric field of the two charges point away from each other. This makes sense because the two positive charges are repelling each other. As they were moved closer together the electric field increased in strength and decreased when spread further apart.


Question 2: Field due to single positive charge
Set Q1 = +10.0 x 10⁻⁸ C. Use Q2 = +4.0 x 10⁻⁸ C as the test charge to measure the electric field due to source charge Q1. Move Q2 to a point 1.0 m to the right side of the source charge Q1 (when r12 = 100 cm--2.5 divisions on the screen). Observe the direction of the electric force exerted by Q1 on Q2. Use the force shown in the simulation

to calculate the electric field caused by Q1 at that point. Then, compare your field calculation with that of the Advisor.


Answer: Using the given force(F12) and charge(q2) we were able to determine the magnitude of the electric field to be 900 N/C.


Open the electric field representation simulation.
Question 3: Representing an electric field
The traditional method for representing an electric field is shown for a single point charge. You can press the pointer down on the screen to see the magnitude of the electric field  at a point. Vary the value and the sign of the charge that is the source of the field (use only one point charge for this activity) and develop some rules for the way that the electric field is represented. Consider in particular:
• the direction of the lines;
• where the lines start or end relative to the sign of the charge causing the field;
• the separation of the lines in a particular region relative to the magnitude of the field in that region;
• the magnitude of the field on a line and in the dark region next to the line, and
• the number of field lines that eminate from or terminate on a point charge relative to the magnitude and sign of that charge.
When finished, compare your observations to those of the Advisor.

 (Positive Charge)
(Negative Charge)

Answer: Based on the two above pictures we can see that when the charge is positive the electric field points away from it and when the charge is negative the electric field points towards it. Another conclusion we can see from these pictures is that as the electric charge increases (positive or negative) the density of the electric field also increases. 


Open the electric field representation simulation.
Force on a charge in the electric field
The force  that an electric field  exerts on a charge q in that field is:
 .
In this simulation, the source charges that produce the field are positive charges distributed uniformly on one metal plate and an equal number of negative charges on the other plate. The electric field produced by these charges is represented by the green lines between the plates. (Be sure that the "Equipotential lines" button is off.) The pointer can grab the charge q and move it to different places between the plates. Before moving the charge, answer these questions.

Question 4: Uniform Field
Explain why the word "uniform" was used in describing the electric field in the middle region between the plates. When finished, compare your thinking to that of the Advisor.

Answer: The word uniform implies that the electric field is the same everywhere between the two plates.


Question 5: Force on a charge in a uniform field
Adjust the plate charge per unit area to 0.6 x 10⁻⁸ C/m2 and the value of the charge q between the plates to +0.5 x 10⁻⁸ C. Suppose you place +q in the middle near the top plate . Note the arrow showing the force on q and the magnitude of that force. Is the force greater in magnitude, the same, or less if qis moved directly below its present position so that it is near the bottom plate? Justify your choice. After your prediction, move q down and compare the force on it when in this new position. When finished, compare your thinking to that of the Advisor.


Answer: The force at the top of the plate and the bottom of the plate turned out to be the same. This fits with what we expected to happen because the electric field between the two plates is uniformly distributed and spaced. This means that the electric field does not depend on its location. 


Question 6: Force on a negative charge
If you leave q in the middle half way between the plates and change the sign of q from +0.5 x 10⁻⁸ C to -0.5 x 10⁻⁸ C, what happens to the force exerted by the field on q. After your prediction, adjust the charge of q to check your thinking. Try different magnitudes of q and different signs. Move q around to different places between the plates and observe the direction and magnitude of the force. Then, move the charge to the sides of the plates where the electric field is not uniform. Are your observations consistent with the equation that relates the field and the force:
 

Answer: The force stays the same whether the charge is positive or negative.

Superposition of Electric Field Vectors


Using excel we determined the Electric Field from Two Point Charges at varying distances. We used this table to help determine the electric field from the two point charges at the measured distances. 


Using the distances from the table above you can easily calculate the electric field to each point.

E-Field Vectors from a Uniformly Charged Rod


Given the above data we determined the electric field from each element to the indicated point. Our answers were calculated in excel and we found the following:


Based on these results we determined the total electric field for a parallel axis to be 5.965·10^5 N/C. The total electric field (Y component) for a perpendicular axis is 1.273·10^6 N/C.

Electric Field Hockey


The goal of the game was to successfully score the positive puck into the goal with the minimum amount of positive or negative charges. For level one I was able to score the goal with only 2 charges. 


The second level proved much more difficult but after several tries I was able to score the puck with only two positive charges. 


Tuesday, March 18, 2014

Day 7: Electric Force

Electric Force Law Video Analysis

For this experiment we were asked to analyze the Coulomb video posted below and determine the charges of the two balls used i the experiment. We were able to determine the charge of each ball with measured values for distance and length (2.00 m), mass (2.93 g), and some trigonometry. 

Experiment

Analysis


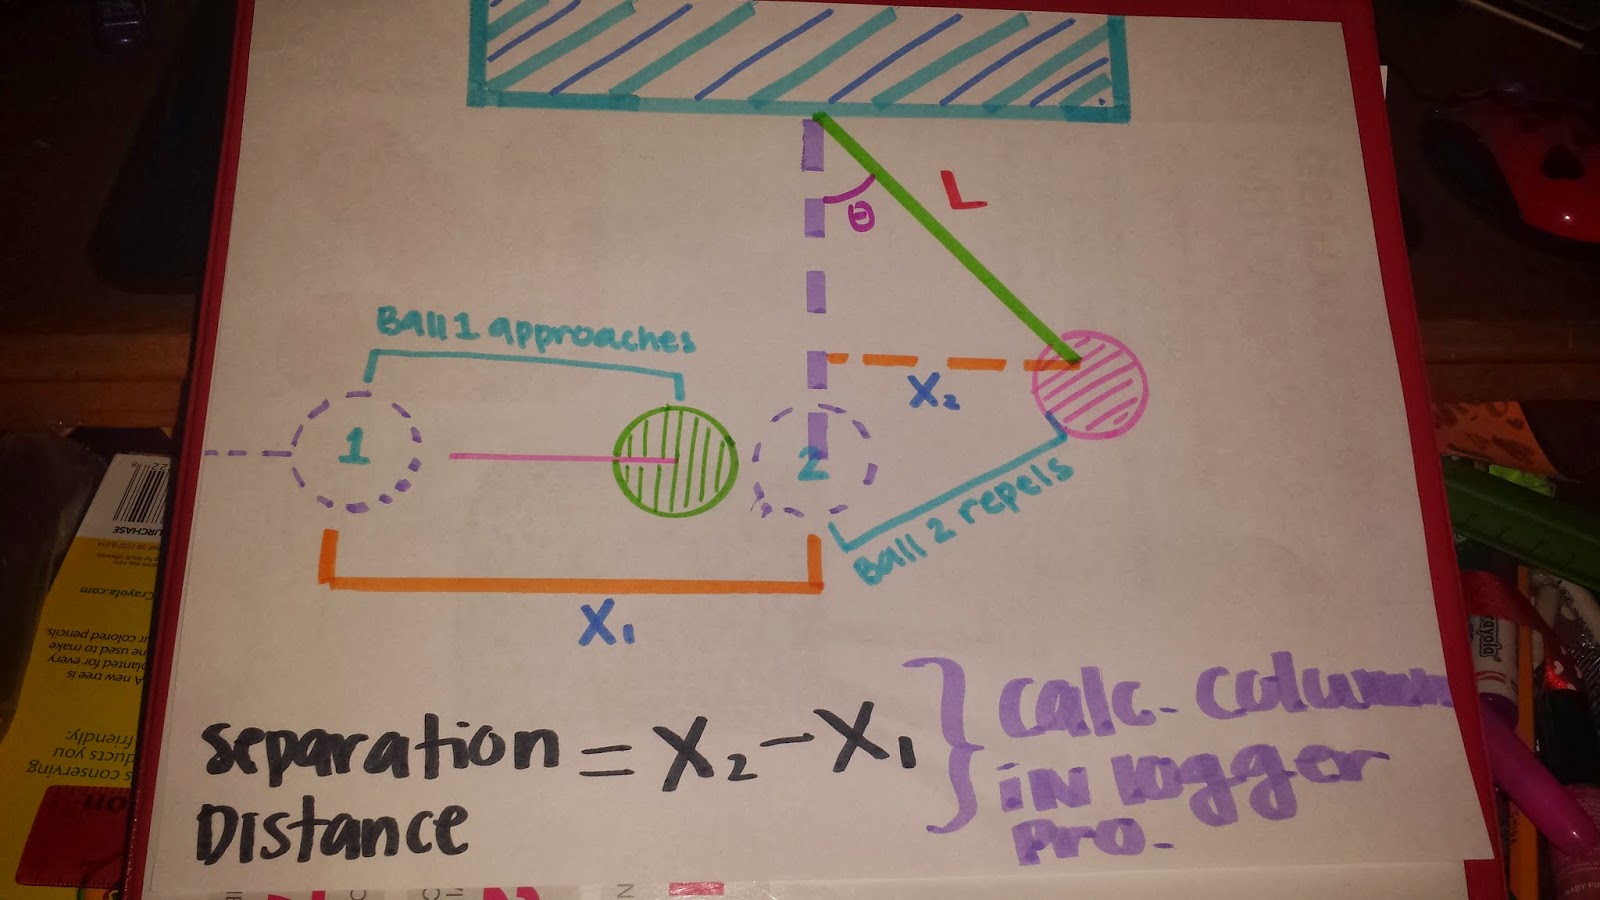
After viewing the video we plotted the movement of each ball with respect to the origin (placed on the hanging ball). Each point helped to determine the values of X1 (the distance between the ball on rod and origin) and X2 (the displacement of the hanging ball from the origin). 


X1 and X2 were crucial values that helped to calculate the separation distance at any given time between the two balls. We imputed the formula XX1 into logger pro as a new calculated column (shown below).


We then used a free body diagram of the forces affecting the hanging ball in order to determine the electric force.


Using what we know about Newtons's Laws. We determined forces in both the X and Y direction and calculated the electric force to be FE=m·g·(tanθ).


Since θ is not a known value in this experiment we could not calculate force with FE=m·g·(tanθ), so we needed to rewrite the formula in terms were given. In this case that meant L, X2, m, or g. With the use of trigonometry and the pythagorean theorem we found a new equation for electric force: FE=m·g·(X2/sqrt(L^2-X2^2)). This formula was used as a new calculated column in logger pro and imputed as shown below. 


After everything was properly input in logger pro we created an Electrical Force vs Separation Distance graph. Our data showed the following result:


The relationship between Electrical Force and Separation Distance turned out to be a inversely proportional (power function was fitted). With our exponent value equaling 1.763.

Conclusion

1. We were able to determine successfully that Electric Force is inversely proportional to the square of the distance between the charges. Based on our graph you can easily see that as the distance between the charges decreases the electric force increases and vice versa.

2. We determined our percent difference between our experimental exponent and the theoretical exponent to be 13.2% (part a). In the scenario where we assumed that the two balls had the same charge (part b), we calculated the charge of each ball to be q=3.91·10^-8 C. In part c where the assumption was made that the charge of the hanging ball was 1/2 that of the other ball we found q2=5.53·10^-8 C and q1=2.76·10^-8 C.


3. From this experiment it is not possible to determine the charges of the ball. All we know for sure is that the sign of the charges for the two balls is the same. Meaning they are both either positively or negatively charged because they repelled when ball 1 approached the hanging ball (ball 2). 

4. Some sources of uncertainty for this experiment include the measurements of distances in logger pro. In order to get the values we had to manually track the movement of the ball and ensure that each time we marked the ball at its center. If this was not done our values might have been slightly off. This would have cause our separations distances to be either higher or lower and give incorrect values for our graph.